Excel for Business Intelligence: Unlocking the Power of Data Analysis

In this blog, we’ll explore how Excel can transform your data approach—from collection and cleaning to complex analysis and interactive dashboards—showcasing the key techniques and advanced features that make Excel indispensable for Business Intelligence.
Table of Contents
-
1. Data Collection and Preparation: The Foundation of Good Analysis
-
2. Data Analysis: Turning Raw Numbers into Insights
-
3. Advanced Techniques: Going Beyond the Basics
-
4. Building Business Intelligence Dashboards: Bringing It All Together
-
5. Collaborating and Protecting Your Work
-
6. Conclusion: Excel is More than Just Spreadsheets
1. Data Collection and Preparation: The Foundation of Good Analysis
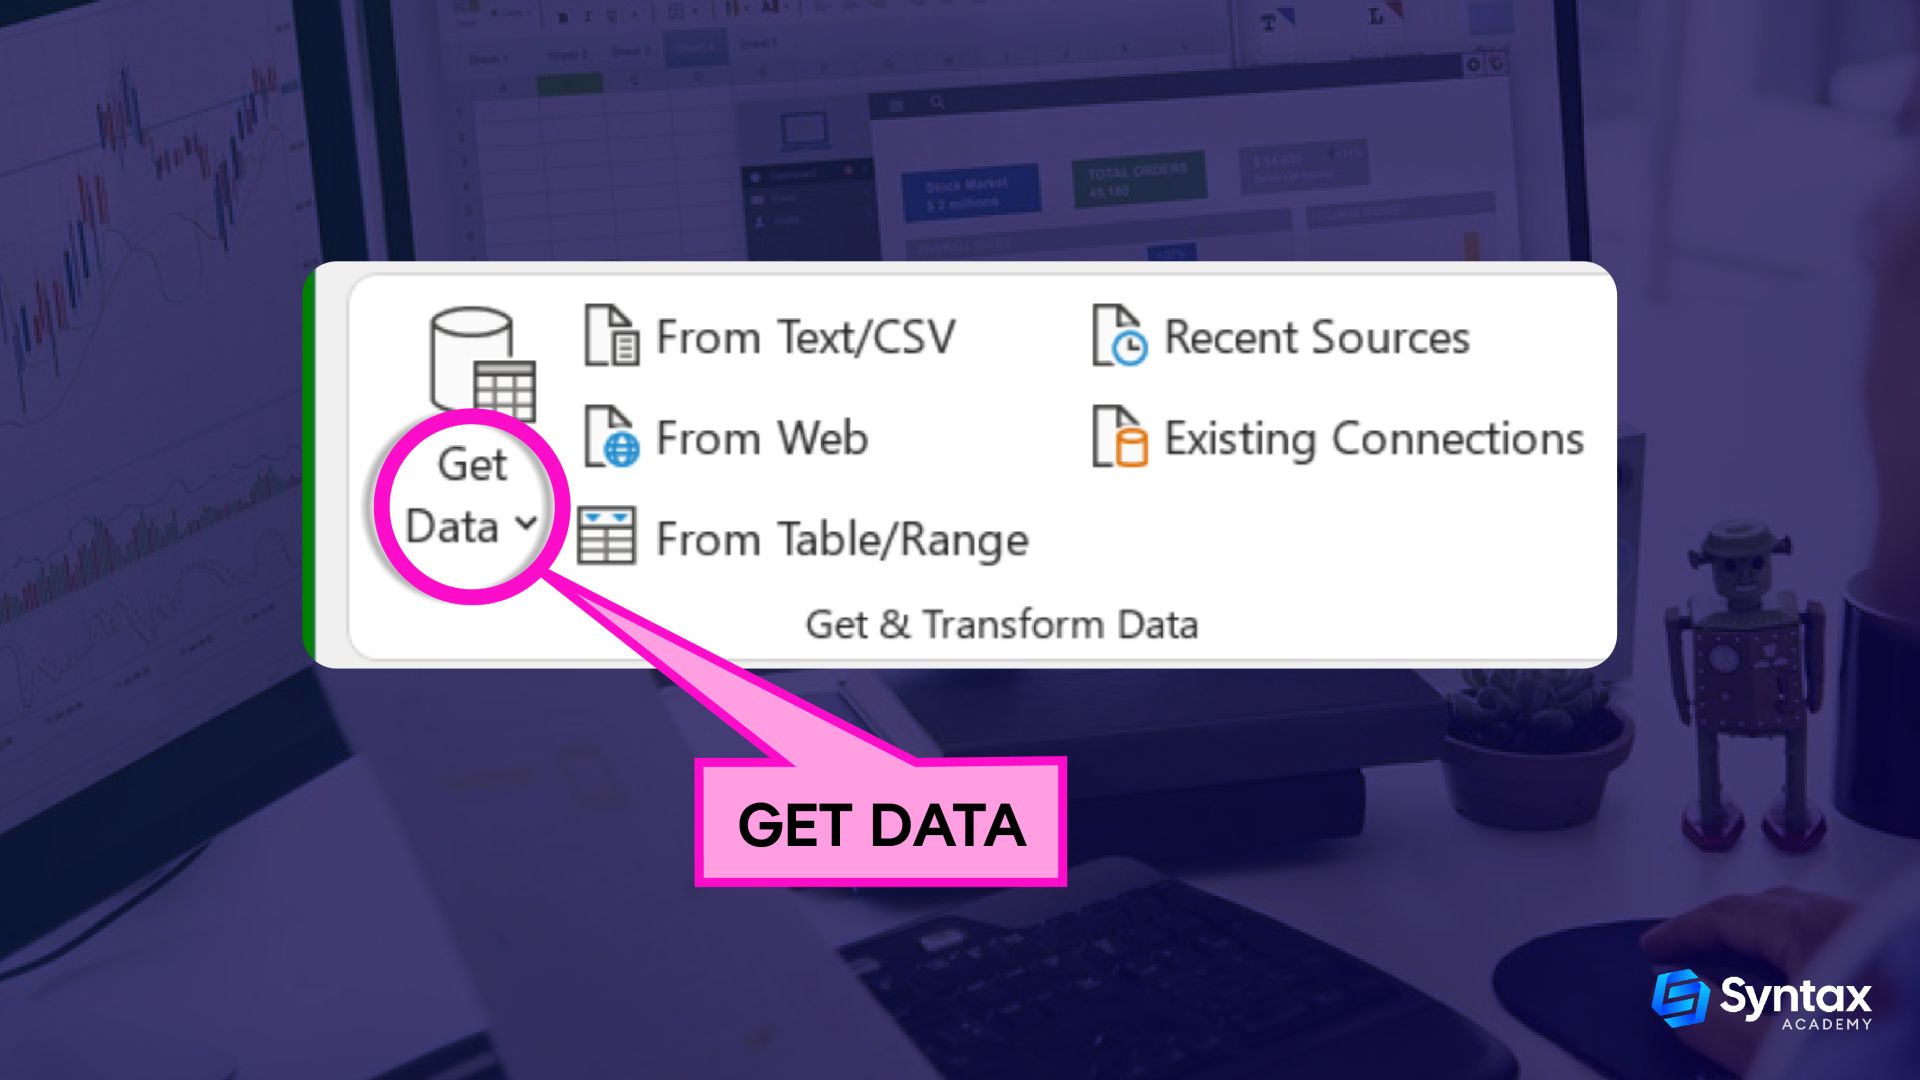
You can pull in data from databases, websites, and even other Excel files. Just head to the "Get Data" button in the Data tab—it’s like Excel’s way of opening the door for all kinds of information to come in.
- Once the data’s in, things can get messy. Cleaning it up is key.
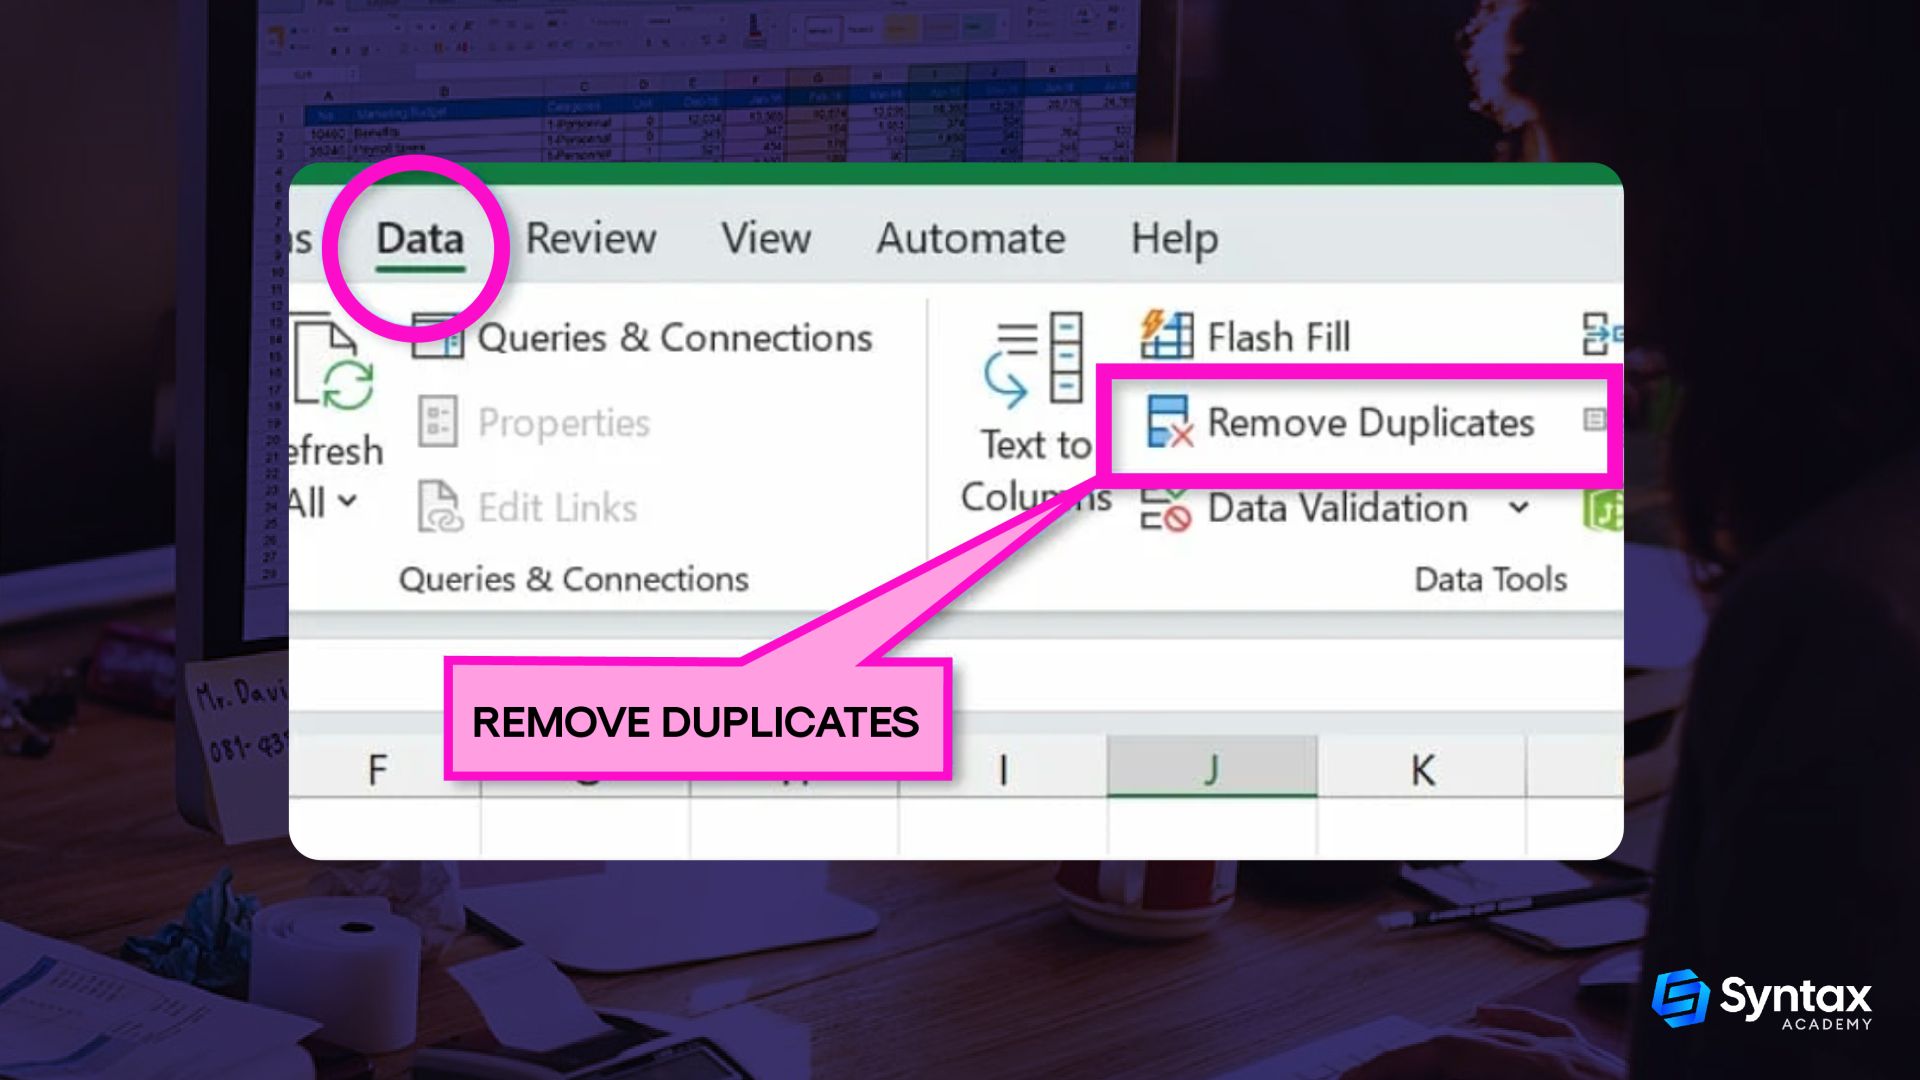
- For example, ever had a list with duplicates? You can remove those in a snap by selecting your data and clicking "Remove Duplicates" in the Data tab. Or, if you’ve ever found yourself with a long list in one column that should be split, "Text to Columns" is your friend. Just set the delimiter, and it’s done!
Organizing your data in tables is a lifesaver. Turn your raw data into a table (Insert > Table), and Excel suddenly feels like it's doing half the work for you—automatic sorting, filtering, and more! Plus, using named ranges instead of cell addresses makes formulas so much clearer.
2. Data Analysis: Turning Raw Numbers into Insights
- Whether you're calculating averages, running statistical analyses, or looking up data from other parts of your workbook, Excel has a formula for that. Logical functions like IF, AND, and OR let you create rules for your data (like categorizing sales as "High" or "Low").
- And if you’re piecing together information from different sheets, VLOOKUP and INDEX-MATCH are your go-to tools.
- If you’ve ever looked at a huge dataset and thought, "How am I supposed to make sense of this?", PivotTables are here to help.
- You can create custom reports, group data, and even throw in some calculated fields to get exactly the insights you need.
- A picture is worth a thousand words, right? Excel’s charts and graphs let you turn numbers into visuals that everyone can understand.
- Whether it’s bar charts, pie charts, or line graphs, Excel has you covered. And with tools like Conditional Formatting, you can highlight the most important bits of your data with just a few clicks.
3. Advanced Techniques: Going Beyond the Basics
- Need quick summary statistics like the mean or standard deviation? Or maybe you're running a regression analysis to spot trends? The Data Analysis Toolpak is like having an extra set of tools for advanced statistics.
- If you're dealing with messy or complicated datasets, Power Query makes cleaning and transforming data much easier. You can filter, sort, and aggregate your data in ways that would take forever manually.
- Handling large datasets that are too big for regular Excel? Power Pivot lets you create complex data models and run analyses on massive datasets without slowing down. Plus, you can use DAX (Data Analysis Expressions) for more sophisticated calculations.
4. Building Business Intelligence Dashboards: Bringing It All Together
- Designing Dashboards: Start by identifying the key metrics that matter—whether that’s sales growth, profit margins, or customer acquisition cost. Then, lay out your dashboard in a way that’s clear and easy to read.
- Interactive Elements: Excel isn’t just for static reports. You can add interactive elements like slicers and timeline slicers to let users explore the data themselves.
5. Collaborating and Protecting Your Work
5. Conclusion: Excel is More than Just Spreadsheets
At the end of the day, Excel isn’t just about crunching numbers—it’s a full-on Business Intelligence tool when used correctly. From data collection to advanced analysis and interactive dashboards, Excel gives you everything you need to turn raw data into actionable insights.
If you’re ready to dive deeper and really master these tools, check out Syntax Academy’s Excel course. You’ll not only learn how to use Excel but how to turn it into a powerful ally for making smart, data-driven decisions.
Share with your community!
Related Article

Generative AI
Exploring the Future of Manufacturing with Generative AI
By: Martha James
Ever picked up your new smartphone or sunk into a chair that just feels right and wondered, “How did this even come to life?” Well, behind every perfectly crafted gadget or piece of furniture is a fascinating world of manufacturing—a process where ideas are turned into real objects. But here’s the twist: manufacturing is no longer just about machines and manual labor. It’s undergoing a revolutionary transformation, all thanks to Generative AI. In this blog, we’re going to dive into how this cutting-edge technology is not only shaking up the manufacturing world but also paving the way for a future filled with smarter, faster, and more sustainable production.
Read More

Generative AI
GenAI: 10 Mind-blowing Use Cases Explained
By: Martha James
Imagine a world where machines don’t just think but create, solve, and revolutionize entire industries. Sounds like science fiction, right? Well, it’s happening right now, and it’s called Generative AI, or GenAI. Whether it’s finding cures for diseases, transforming education, or enhancing how we experience entertainment, GenAI is rewriting the rules across the board.In this blog, we’ll explore ten jaw-dropping ways GenAI is changing the world around us. From healthcare breakthroughs to smarter shopping, you'll see how this powerful technology is reshaping industries and opening up endless possibilities.
Read More

Generative AI
Top Generative AI Jobs in 2024
By: Martha James
Step into the future of work in 2024, where humans team up with Artificial Intelligence for groundbreaking opportunities. It's a time of big changes in how we do our jobs, with AI playing a major role. Imagine working alongside smart machines that help us do things faster and better. In this exciting new era, we'll dive into the world of GenAI jobs, discovering how they're reshaping the way we work and what it means for you.
Read More
Professionals from Industry Pioneers Choose
Syntax Academy for Skill Mastery